ملف:ShockleyQueisserVOC.svg

من أرابيكا، الموسوعة الحرة
اذهب إلى التنقل اذهب إلى البحث

الملف الأصلي(ملف SVG، أبعاده 742 × 732 بكسل، حجم الملف: 27 كيلوبايت)

ملخص

الوصف
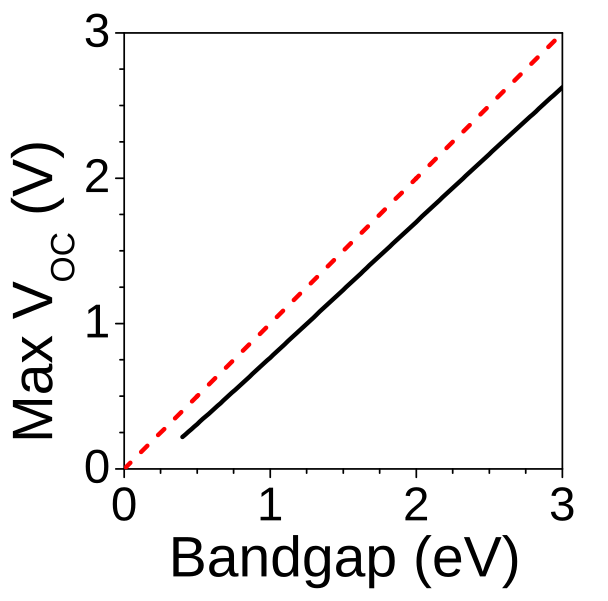
English: Black curve: The limit for the maximum open-circuit current of a solar cell within the Shockley-Queisser model. The x-axis is the bandgap of the solar cell in electron volts, the y-axis is the highest possible open-circuit voltage in volts. The red dotted line is "y=x", showing that the open-circuit voltage is always somewhat smaller than the bandgap voltage. (The model assumes a single-junction solar cell under unconcentrated light, and some other assumptions too. I used the AM1.5G solar spectrum data for the calculation.) I cross-checked my curve with an independently-calculated one and they agree to high accuracy, see Practical Handbook of Photovoltaics p129.
Русский: Черная линия — предел максимального напряжения холостого хода солнечного элемента в модели Шокли — Кейсера. По оси X отложена запрещенная зона солнечного элемента в электрон-вольтах, по оси Y — максимально возможное напряжение холостого хода в вольтах. Красная пунктирная линия — «y=x», проведена для иллюстрации, что напряжение холостого хода всегда несколько меньше напряжения запрещенной зоны.
التاريخ
المصدر عمل شخصي
المؤلف Sbyrnes321
إصدارات أخرى

I did the calculation in Mathematica, plotted it in Origin, and did PDF-->SVG conversion in Inkscape. Then a few years later, I ported the code from Mathematica to Python, and you can now see the whole calculation and results at https://github.com/sbyrnes321/SolarCellEfficiencyLimits/blob/master/sq.ipynb

ترخيص

Public domain أنا، مالِك حقوق تأليف ونشر هذا العمل، أجعله في النِّطاق العامِّ، يسري هذا في أرجاء العالم كلِّه.
في بعض البلدان، قد يكون هذا التَّرخيص غيرَ مُمكنٍ قانونيَّاً، في هذه الحالة:
أمنح الجميع حق استخدام هذا العمل لأي غرض دون أي شرط ما لم يفرض القانون شروطًا إضافية.

الشروحات

أضف شرحاً من سطر واحد لما يُمثِّله هذا الملف

العناصر المصورة في هذا الملف

يُصوِّر

٨ فبراير 2011

تاريخ الملف

اضغط على زمن/تاريخ لرؤية الملف كما بدا في هذا الزمن.

زمن/تاريخصورة مصغرةالأبعادمستخدمتعليق
حالي12:30، 9 فبراير 2011تصغير للنسخة بتاريخ 12:30، 9 فبراير 2011742 × 732 (27 كيلوبايت)commonswiki>Sbyrnes321{{Information |Description ={{en|1=Black curve: The limit for the maximum open-circuit current of a solar cell within the Shockley-Queisser model. The x-axis is the bandgap of the solar cell in electron volts, the y-axis is the highest possible open-ci

ال1 ملف التالي مكررات لهذا الملف (المزيد من التفاصيل):

الصفحة التالية تستخدم هذا الملف: