ملف:LogisticMap BifurcationDiagram.png
الملف الأصلي(1٬838 × 1٬300 بكسل حجم الملف: 571 كيلوبايت، نوع MIME: image/png)

ملخص

الوصف
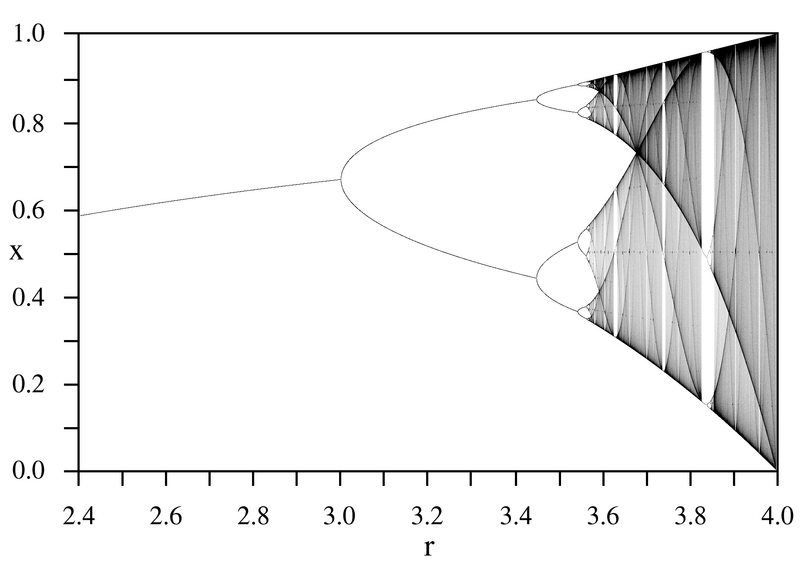
English: A bifurcation diagram for the Logistic map:
The horizontal axis is the r parameter, the vertical axis is the x variable. The image was created by forming a 1601 x 1001 array representing increments of 0.001 in r and x. A starting value of x=0.25 was used, and the map was iterated 1000 times in order to stabilize the values of x. 100,000 x -values were then calculated for each value of r and for each x value, the corresponding (x,r) pixel in the image was incremented by one. All values in a column (corresponding to a particular value of r) were then multiplied by the number of non-zero pixels in that column, in order to even out the intensities. Values above 250,000 were set to 250,000, and then the entire image was normalized to 0-255. Finally, pixels for values of r below 3.57 were darkened to increase visibility.
التاريخ
المصدر عمل شخصي
المؤلف PAR

ترخيص

Public domain أنا، مالِك حقوق تأليف ونشر هذا العمل، أجعله في النِّطاق العامِّ، يسري هذا في أرجاء العالم كلِّه.
في بعض البلدان، قد يكون هذا التَّرخيص غيرَ مُمكنٍ قانونيَّاً، في هذه الحالة:
أمنح الجميع حق استخدام هذا العمل لأي غرض دون أي شرط ما لم يفرض القانون شروطًا إضافية.
هذه الصورة / الصورتان باستعمال رسومات متجهية ملفات رسوميات شعاعية. It is recommended to name the SVG file "LogisticMap BifurcationDiagram.svg" - then the template Vector version available (or Vva) does not need the new image name parameter.

الشروحات

أضف شرحاً من سطر واحد لما يُمثِّله هذا الملف

العناصر المصورة في هذا الملف

يُصوِّر

١٤ سبتمبر 2005

تاريخ الملف

اضغط على زمن/تاريخ لرؤية الملف كما بدا في هذا الزمن.

زمن/تاريخصورة مصغرةالأبعادمستخدمتعليق
حالي04:11، 14 سبتمبر 2005تصغير للنسخة بتاريخ 04:11، 14 سبتمبر 20051٬838 × 1٬300 (571 كيلوبايت)commonswiki>PAR~commonswiki Bifurcation diagram for the logistic map for parameter r=2.4 to 4.0.

ال1 ملف التالي مكررات لهذا الملف (المزيد من التفاصيل):

الصفحة التالية تستخدم هذا الملف: