|
تضامنًا مع حق الشعب الفلسطيني |
ملف:Oil Prices Since 1861.svg

الملف الأصلي (ملف SVG، أبعاده 1٬450 × 414 بكسل، حجم الملف: 27 كيلوبايت)
| هذا ملف من ويكيميديا كومنز. معلومات من صفحة وصفه مبينة في الأسفل. كومنز مستودع ملفات ميديا ذو رخصة حرة. |
ملخص
| الوصف |
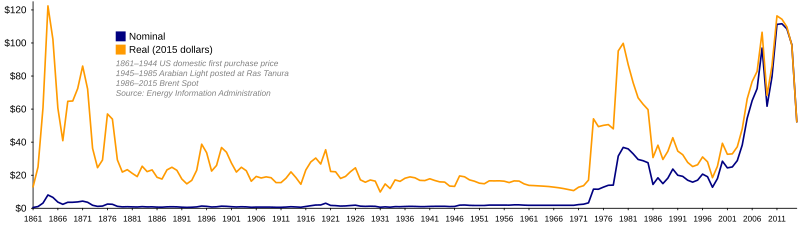
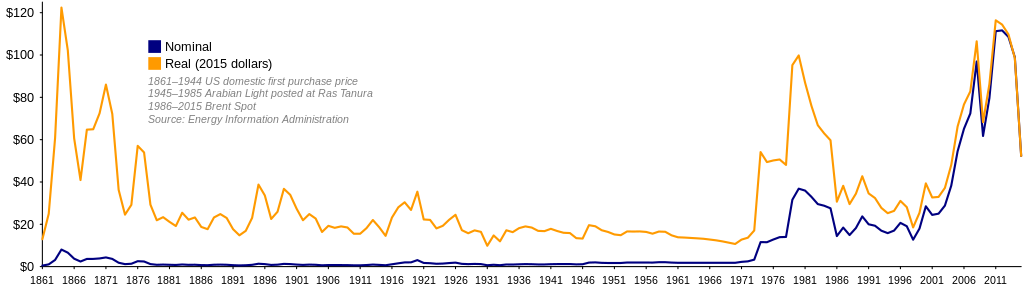
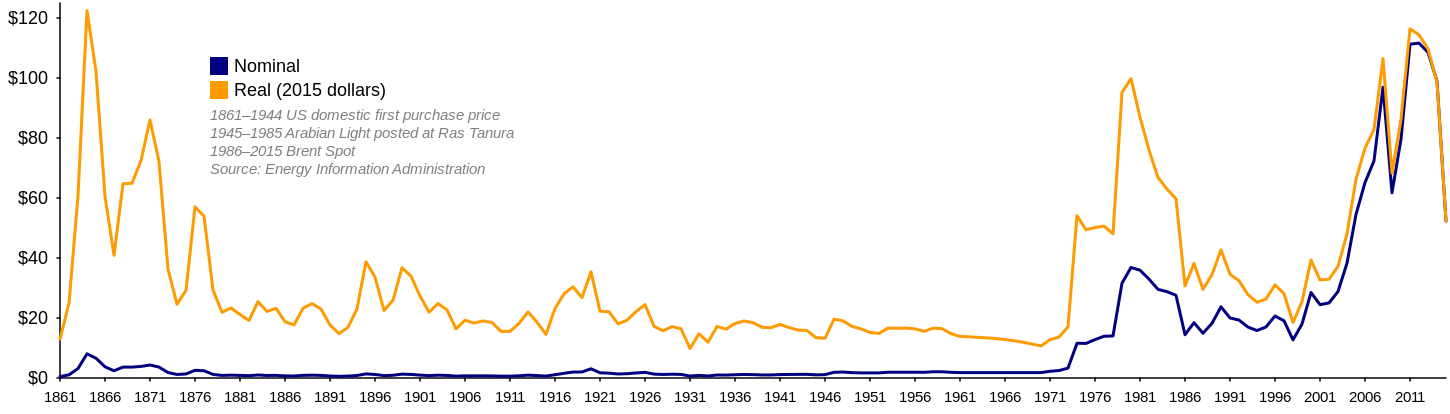
I saw Image:Oil Prices 1861 2006.jpg recently and found it to be very useful. I noticed that it was in JPEG format, and saw that it was based on government sources which are available online, so I decided to recreate it in a lossless image format and update it to 2007. I've been experimenting with SVG lately, so I decided to try that instead of just saving a chart as a PNG. I found that I had to do a good bit of reverse engineering of data, and so I would like to document that here so that this graph can be more easily maintained in the future. I found that the source quoted by the previous image, this spreadsheet from the Energy Information Administration (EIA), only provides data up to 1999 and uses 1999 dollars. It appears to provide conversions to real 1999 dollars using the United States Consumer Price Index (CPI), available from the Bureau of Labor Statistics here. I studied the EIA web site further and noted that the author of the previous image brought the above spreadsheet up to date using the latest Brent Spot prices, available on this spreadsheet, also from the EIA. The update to 2006 dollars also appears to use the CPI. I used the newest version of the above Brent Spot spreadsheet to get prices up to 2007, and converted to 2007 dollars using the latest CPI data. I have thought about how to incorporate 2008 data, but haven't decided how to do it yet. The chart currently uses yearly averages; since 2008's not over yet, we don't have an average price for this year. I have to integrate it in a way that doesn't hurt the accuracy of the graph. I have put further thought into how the EIA's 1861–1999 spreadsheet is constructed, with the intention of possibly improving it. I am not a commodities broker, nor am I an oil man, but I have a few thoughts:
I am not a big fan of how the graph is a composite of three different sources. It sort of seems like an apples and oranges comparison to me. The 1861–1944 data is domestic crude oil first purchase price. The EIA defines "first purchase" this way:
The data from 1945–1985 is, as far as I understand, the price you would have paid for a barrel of light crude if you had dropped anchor at Ras Tanura and said "Load it up!". The price from 1986–present is the price you would have paid if you had gone into the International Petroleum Exchange in London flapping your arms around and shouting (or, starting in 2005, put a message to IntercontinentalExchange into a series of tubes). These all seems subtly different to me. I think it would be better if the entire chart relied on the same source. Oil was not extracted in large quantities in the Middle East until the mid-20th century, and was first drilled in the North Sea in the 1970s, but the EIA has US domestic oil prices from 1859 all the way to today. It has month-by-month prices from 1974. Because the prices are for oil right at the field, they are lower than the market prices we're used to hearing, but they are still real prices and are from a consistent source. I am considering making a version of this graph that uses US domestic first purchase prices exclusively, and uses monthly data from 1974 onward so that we can go all the way to last month instead of waiting for the yearly average. I made a graph that shows monthly Brent spot prices, which is available here. It provides a detailed, recent history. I plan to make some more graphs in the future. |
| التاريخ | |
| المصدر | عمل شخصي |
| المؤلف | TomTheHand |
| إصدارات أخرى | Arabic |
Comment by Sammy Finkelman: Maybe for years before 1913 the Wholesale Price Index was used? That has been calculated back to 1749 and was published as far back as 1955 and maybe earlier.
If you do a Google Search for "Wholesale Price Index" 1749, you'll find an article from TIME Magazine from 1959 that discusses this a little bit. The Wholesale Price Index by now has been calculated back to 1720. They use different sources for different years.
ترخيص
- يحقُّ لك:
- مشاركة العمل – نسخ العمل وتوزيعه وبثُّه
- إعادة إنتاج العمل – تعديل العمل
- حسب الشروط التالية:
- نسب العمل إلى مُؤَلِّفه – يلزم نسب العمل إلى مُؤَلِّفه بشكل مناسب وتوفير رابط للرخصة وتحديد ما إذا أجريت تغييرات. بالإمكان القيام بذلك بأية طريقة معقولة، ولكن ليس بأية طريقة تشير إلى أن المرخِّص يوافقك على الاستعمال.
- الإلزام بترخيص المُشتقات بالمثل – إذا أعدت إنتاج المواد أو غيرت فيها، فيلزم أن تنشر مساهماتك المُشتقَّة عن الأصل تحت ترخيص الأصل نفسه أو تحت ترخيص مُتوافِقٍ معه.

|
يسمح نسخ وتوزيع و/أو تعديل هذه الوثيقة تحت شروط رخصة جنو للوثائق الحرة، الإصدار 1.2 أو أي إصدار لاحق تنشره مؤسسة البرمجيات الحرة؛ دون أقسام ثابتة ودون نصوص أغلفة أمامية ودون نصوص أغلفة خلفية. نسخة من الرخصة تم تضمينها في القسم المسمى GNU Free Documentation License. |
تاريخ الملف
اضغط على زمن/تاريخ لرؤية الملف كما بدا في هذا الزمن.
| زمن/تاريخ | صورة مصغرة | الأبعاد | مستخدم | تعليق | |
|---|---|---|---|---|---|
| حالي | 12:18، 28 فبراير 2016 | 1٬450 × 414 (27 كيلوبايت) | commonswiki>Delphi234 | 2015 |
استخدام الملف
ال1 ملف التالي مكررات لهذا الملف (المزيد من التفاصيل):
- ملف:Oil Prices Since 1861.svg من ويكيميديا كومنز
الصفحتان التاليتان تستخدمان هذا الملف: