|
تضامنًا مع حق الشعب الفلسطيني |
ملف:US timeline. Illicit opioid deaths.jpg
اذهب إلى التنقل
اذهب إلى البحث
حجم هذه المعاينة: 742 × 599 بكسل. الأبعاد الأخرى: 297 × 240 بكسل | 594 × 480 بكسل | 816 × 659 بكسل.
الملف الأصلي (816 × 659 بكسل حجم الملف: 101 كيلوبايت، نوع MIME: image/jpeg)
| هذا ملف من ويكيميديا كومنز. معلومات من صفحة وصفه مبينة في الأسفل. كومنز مستودع ملفات ميديا ذو رخصة حرة. |

|
يُمثِّل: File:US timeline. Illicit opioid deaths.svg نسخةً شعاعيَّةً لهذه الصورة. ينبغي أن تستخدم الصورة الشعاعيَّة عندما تكون أعلى جودةً مِن الصورة النقطيَّة.
File:US timeline. Illicit opioid deaths.jpg → File:US timeline. Illicit opioid deaths.svg
للمزيد من المعلومات، راجع صفحة Help:SVG. |
 |
ملخص
| الوصف |
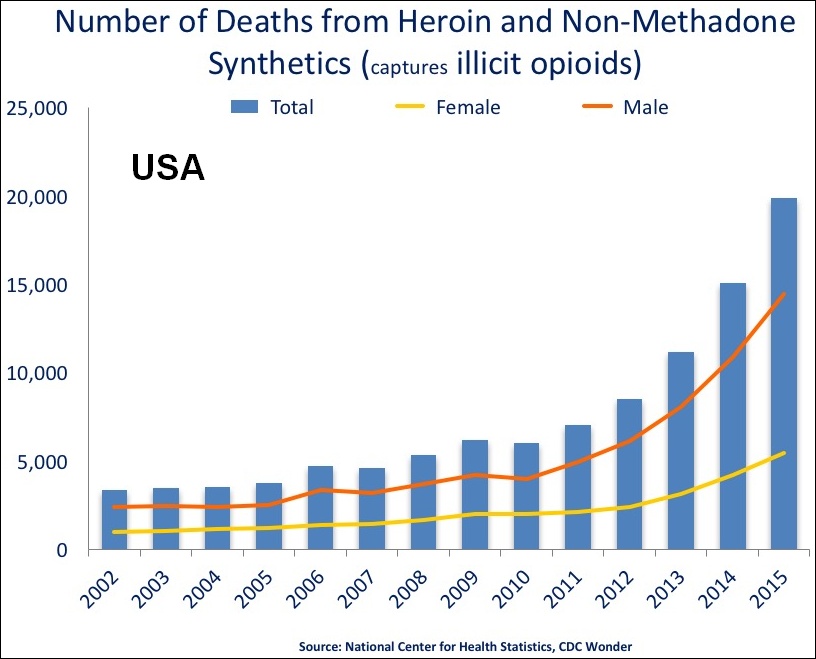
English: "National Overdose Deaths—Number of Deaths from Heroin and Non-Methadone Synthetics. The figure above is a bar chart showing the total number of U.S. overdose deaths involving heroin and non-methadone synthetics from 2002 to 2015. The latter category is dominated by illicit fentanyl overdose; when combined with heroin, these numbers capture illicit opioid deaths. The chart is overlayed by a line graph showing the number of deaths of females and males. From 2002 to 2015 there was a 5.9-fold increase in the total number of deaths." |
| التاريخ | - date at source page at the time the latest chart was uploaded here. "Revised September 2017". |
| المصدر | 2002-2015 chart from Overdose Death Rates. By National Institute on Drug Abuse (NIDA). |
| المؤلف | National Institute on Drug Abuse. And User:Timeshifter. I (Timeshifter) cropped the original chart, and added "USA" to it. Freeware IrfanView was used. I put the adapted chart under the same public domain license. See Commons:Convert tables and charts to wiki code or image files, and the section about adding text to chart images. |
ترخيص
هذه الصُّورة هي عملٌ مِن إِنتاج معاهد الصِّحة الوطنية الأَمريكيَّة، وهي جزءٌ من وزارة الصِّحة والخدمات البشريَّة في الولايات المُتحدة الأمريكيَّة. وبما أنَّها عملٌ من إِنتاج الحكومة الاتحادية للولايات المُتحدة، فإِنَّ هذه الصُّورة في تقعُ في النِّطاق العامّ.
 |
||
| هذا الملفُّ مَلحُوظُ بصفته غيرَ مُقيَّدٍ بحقوق التَّأليف والنشر، وهذا يشمل أيضاً الحقوق المُجاوِرة أَو ذات الصلة جميعُها. | ||
تاريخ الملف
اضغط على زمن/تاريخ لرؤية الملف كما بدا في هذا الزمن.
| زمن/تاريخ | صورة مصغرة | الأبعاد | مستخدم | تعليق | |
|---|---|---|---|---|---|
| حالي | 18:43، 29 أكتوبر 2017 | | 816 × 659 (101 كيلوبايت) | commonswiki>Timeshifter | User created page with UploadWizard |
استخدام الملف
ال1 ملف التالي مكررات لهذا الملف (المزيد من التفاصيل):
- ملف:US timeline. Illicit opioid deaths.jpg من ويكيميديا كومنز
الصفحة التالية تستخدم هذا الملف: