|
تضامنًا مع حق الشعب الفلسطيني |
ملف:US timeline. Drugs involved in overdose deaths.jpg
اذهب إلى التنقل
اذهب إلى البحث

حجم هذه المعاينة: 800 × 600 بكسل. الأبعاد الأخرى: 320 × 240 بكسل | 640 × 480 بكسل | 1٬024 × 768 بكسل | 1٬200 × 900 بكسل.
الملف الأصلي (1٬200 × 900 بكسل حجم الملف: 169 كيلوبايت، نوع MIME: image/jpeg)
| هذا ملف من ويكيميديا كومنز. معلومات من صفحة وصفه مبينة في الأسفل. كومنز مستودع ملفات ميديا ذو رخصة حرة. |

|
يُمثِّل: File:US timeline - Drugs involved in overdose deaths.svg نسخةً شعاعيَّةً لهذه الصورة. ينبغي أن تستخدم الصورة الشعاعيَّة عندما تكون أعلى جودةً مِن الصورة النقطيَّة.
File:US timeline. Drugs involved in overdose deaths.jpg → File:US timeline - Drugs involved in overdose deaths.svg
للمزيد من المعلومات، راجع صفحة Help:SVG. |
 |
ملخص
| الوصف |
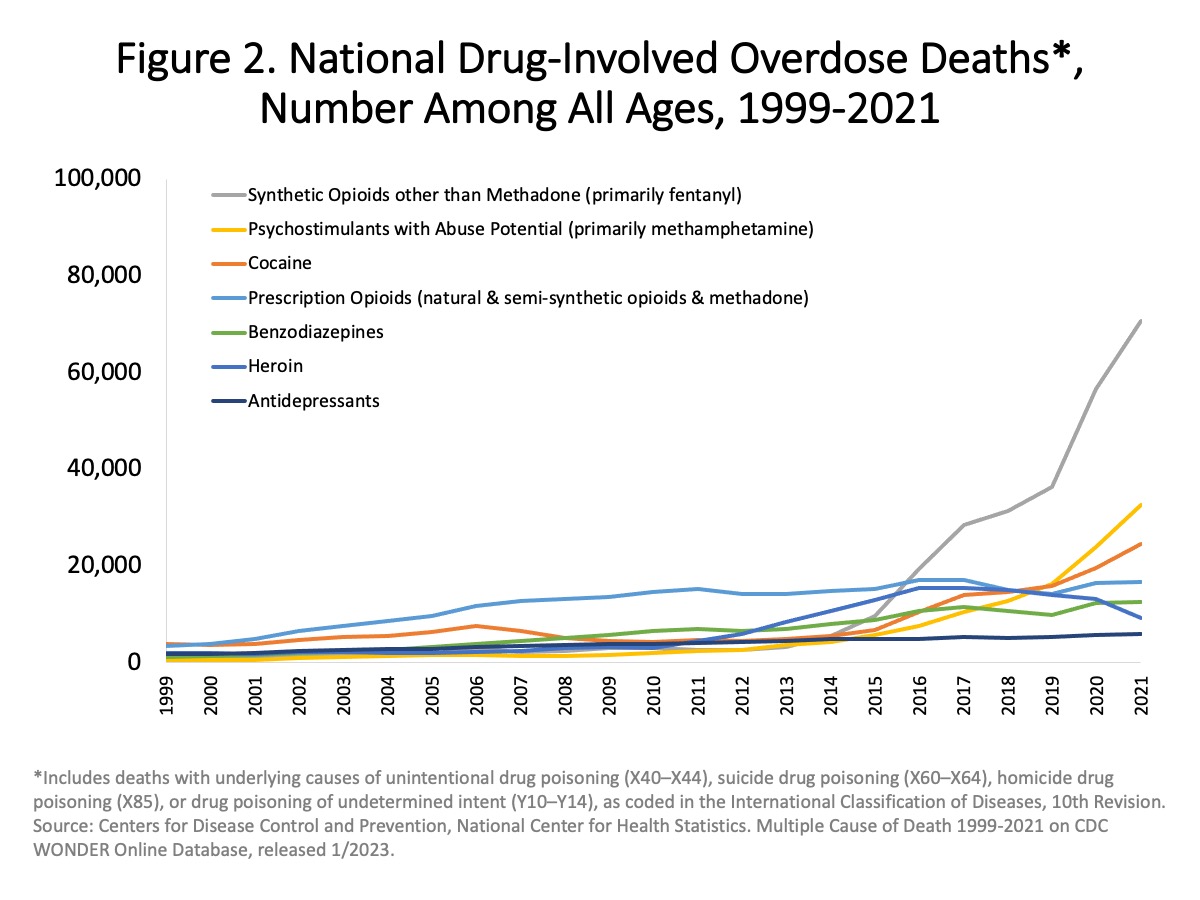
English: From source: "Figure 2. National Drug-Involved Overdose Deaths by Specific Category—Number Among All Ages, 1999-2021. Overall, drug overdose deaths rose from 2019 to 2021 with more than 106,000 drug overdose deaths reported in 2021. Deaths involving synthetic opioids other than methadone (primarily fentanyl) continued to rise with 70,601 overdose deaths reported in 2021. Those involving stimulants, including cocaine or psychostimulants with abuse potential (primarily methamphetamine), also continued to increase with 32,537 overdose deaths in 2021 (Source: CDC WONDER)." |
| التاريخ | - date of first upload to the Commons. See file history for dates of later uploads. |
| المصدر | Overdose Death Rates. By National Institute on Drug Abuse (NIDA). See links section near the bottom of the page for the latest data link, and a PowerPoint link. See also CDC's searchable database, called CDC Wonder. 1999-2021 chart. 1999-2020 chart. 1999-2019 chart. 1999-2017 chart from PDF with larger version of chart. 1999-2017 provisional chart. 2000-2016 chart. |
| المؤلف | National Institute on Drug Abuse. On some versions of the chart here on the Commons User:Timeshifter used freeware IrfanView to crop out the outer white space, edit text at the top, and add a border. See Commons:Convert tables and charts to wiki code or image files, and the section about adding and editing text on chart images. |
ترخيص
هذه الصُّورة هي عملٌ مِن إِنتاج معاهد الصِّحة الوطنية الأَمريكيَّة، وهي جزءٌ من وزارة الصِّحة والخدمات البشريَّة في الولايات المُتحدة الأمريكيَّة. وبما أنَّها عملٌ من إِنتاج الحكومة الاتحادية للولايات المُتحدة، فإِنَّ هذه الصُّورة في تقعُ في النِّطاق العامّ.
 |
||
| هذا الملفُّ مَلحُوظُ بصفته غيرَ مُقيَّدٍ بحقوق التَّأليف والنشر، وهذا يشمل أيضاً الحقوق المُجاوِرة أَو ذات الصلة جميعُها. | ||
تاريخ الملف
اضغط على زمن/تاريخ لرؤية الملف كما بدا في هذا الزمن.
| زمن/تاريخ | صورة مصغرة | الأبعاد | مستخدم | تعليق | |
|---|---|---|---|---|---|
| حالي | 03:37، 22 يوليو 2023 | | 1٬200 × 900 (169 كيلوبايت) | commonswiki>Jmabel | updated again |
استخدام الملف
ال1 ملف التالي مكررات لهذا الملف (المزيد من التفاصيل):
- ملف:US timeline. Drugs involved in overdose deaths.jpg من ويكيميديا كومنز
الصفحة التالية تستخدم هذا الملف: