|
تضامنًا مع حق الشعب الفلسطيني |
ملف:Timeline of US overdose deaths involving heroin, by other opioid involvement.jpg
اذهب إلى التنقل
اذهب إلى البحث

حجم هذه المعاينة: 800 × 600 بكسل. الأبعاد الأخرى: 320 × 240 بكسل | 640 × 480 بكسل | 1٬024 × 768 بكسل | 1٬200 × 900 بكسل.
الملف الأصلي (1٬200 × 900 بكسل حجم الملف: 188 كيلوبايت، نوع MIME: image/jpeg)
| هذا ملف من ويكيميديا كومنز. معلومات من صفحة وصفه مبينة في الأسفل. كومنز مستودع ملفات ميديا ذو رخصة حرة. |

|
يُمثِّل: File:US timeline. Heroin deaths.svg نسخةً شعاعيَّةً لهذه الصورة. ينبغي أن تستخدم الصورة الشعاعيَّة عندما تكون أعلى جودةً مِن الصورة النقطيَّة.
File:Timeline of US overdose deaths involving heroin, by other opioid involvement.jpg → File:US timeline. Heroin deaths.svg
للمزيد من المعلومات، راجع صفحة Help:SVG. |
 |
ملخص
| الوصف |
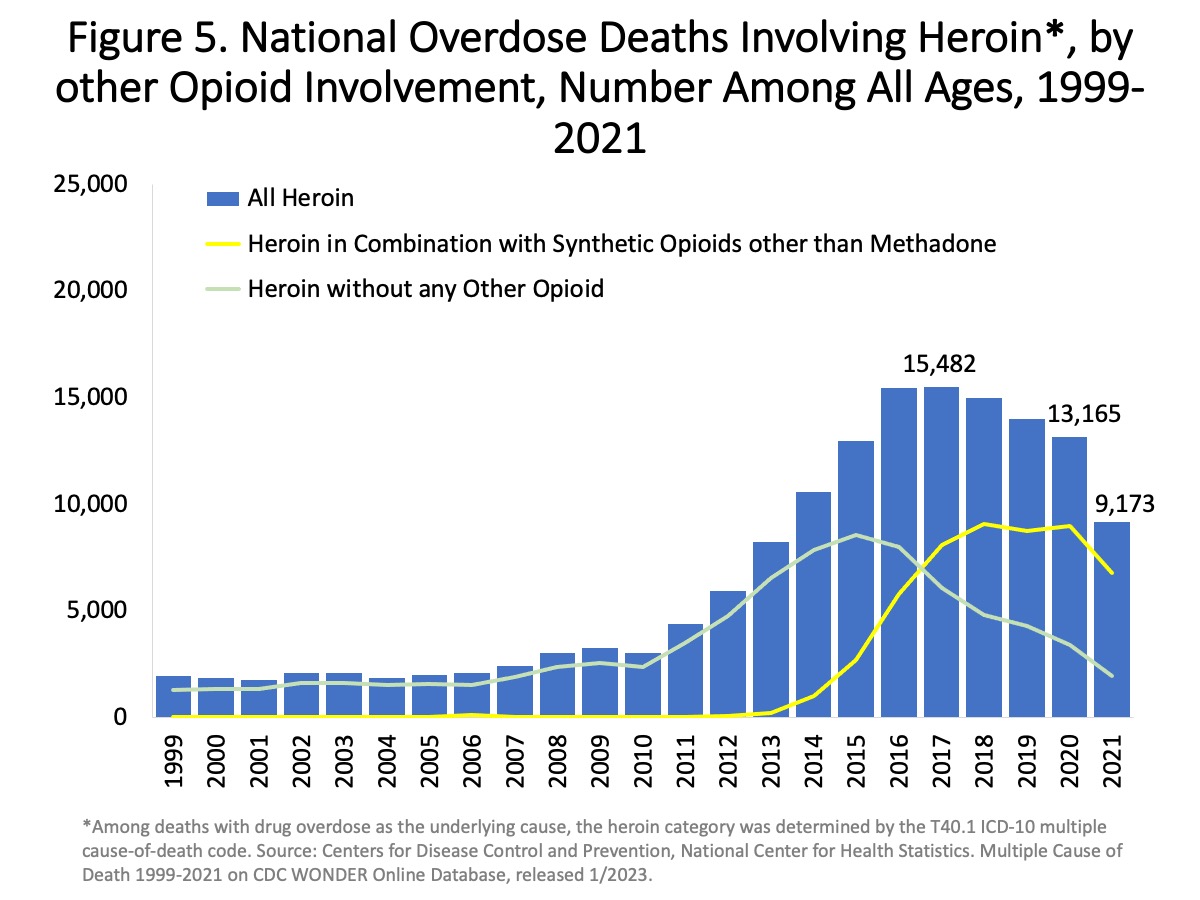
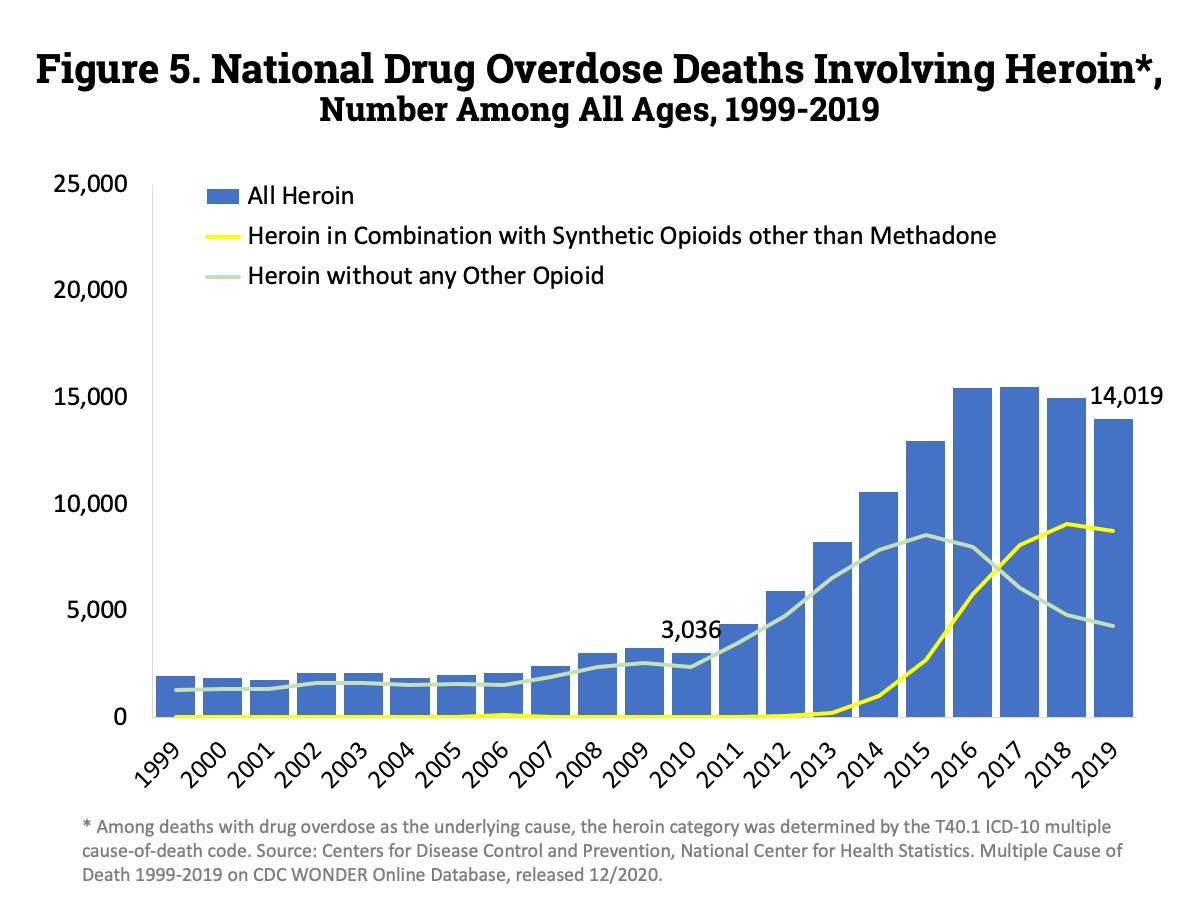
English: "Figure 5. National Overdose Deaths Involving Heroin, by Other Opioid Involvement—Number Among All Ages, 1999-2021. The figure above is a bar and line graph showing the total number of U.S. overdose deaths involving heroin from 1999 to 2021. Drug overdose deaths involving heroin rose from 1,960 in 1999 to 15,482 in 2017 before trending down to 13,165 deaths in 2020 and 9,173 deaths in 2021. The bars are overlaid by lines showing the number of deaths involving heroin in combination with synthetic opioids other than methadone (primarily fentanyl) or without any other opioid from 1999 to 2021 (Source: CDC WONDER)." |
| التاريخ | - date of first upload to the Commons. See file history for dates of later uploads. |
| المصدر | Overdose Death Rates. By National Institute on Drug Abuse (NIDA). 1999-2021 chart. 1999-2019 chart. 2002-2017 chart. 2002-2015 chart. 2001-2014 chart. |
| المؤلف | National Institute on Drug Abuse. Some versions of the chart were cropped, and have had "USA" added to them. Freeware IrfanView, etc. can be used. See Commons:Convert tables and charts to wiki code or image files, and the section about adding text to chart images. |
ترخيص
هذه الصُّورة هي عملٌ مِن إِنتاج معاهد الصِّحة الوطنية الأَمريكيَّة، وهي جزءٌ من وزارة الصِّحة والخدمات البشريَّة في الولايات المُتحدة الأمريكيَّة. وبما أنَّها عملٌ من إِنتاج الحكومة الاتحادية للولايات المُتحدة، فإِنَّ هذه الصُّورة في تقعُ في النِّطاق العامّ.
 |
||
| هذا الملفُّ مَلحُوظُ بصفته غيرَ مُقيَّدٍ بحقوق التَّأليف والنشر، وهذا يشمل أيضاً الحقوق المُجاوِرة أَو ذات الصلة جميعُها. | ||
تاريخ الملف
اضغط على زمن/تاريخ لرؤية الملف كما بدا في هذا الزمن.
| زمن/تاريخ | صورة مصغرة | الأبعاد | مستخدم | تعليق | |
|---|---|---|---|---|---|
| حالي | 04:00، 22 يوليو 2023 | | 1٬200 × 900 (188 كيلوبايت) | commonswiki>Timeshifter | Latest |
استخدام الملف
ال1 ملف التالي مكررات لهذا الملف (المزيد من التفاصيل):
ال4 صفحات التالية تستخدم هذا الملف: