|
تضامنًا مع حق الشعب الفلسطيني |
ملف:Sinc function (normalized).svg
اذهب إلى التنقل
اذهب إلى البحث

حجم معاينة PNG لذلك الملف ذي الامتداد SVG: 800 × 549 بكسل. الأبعاد الأخرى: 320 × 220 بكسل | 640 × 439 بكسل | 1٬024 × 703 بكسل | 1٬280 × 878 بكسل | 2٬560 × 1٬756 بكسل | 908 × 623 بكسل.
الملف الأصلي (ملف SVG، أبعاده 908 × 623 بكسل، حجم الملف: 4 كيلوبايت)
| هذا ملف من ويكيميديا كومنز. معلومات من صفحة وصفه مبينة في الأسفل. كومنز مستودع ملفات ميديا ذو رخصة حرة. |
ملخص
| الوصف |
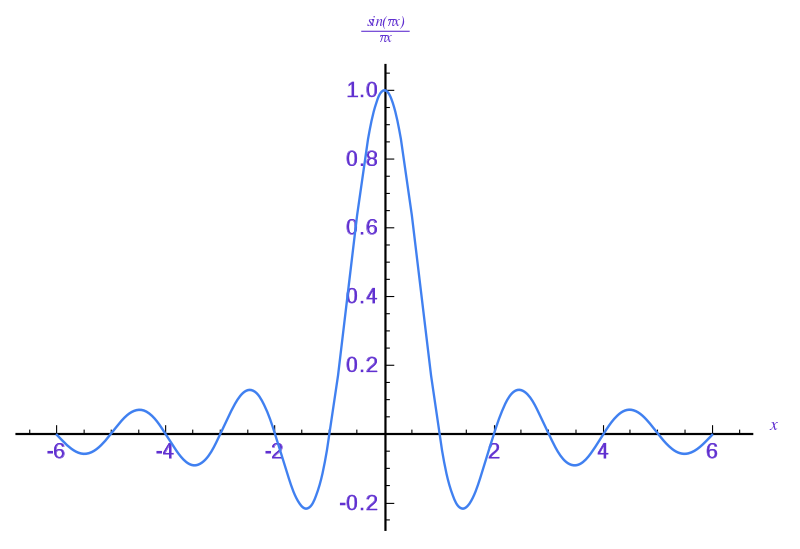
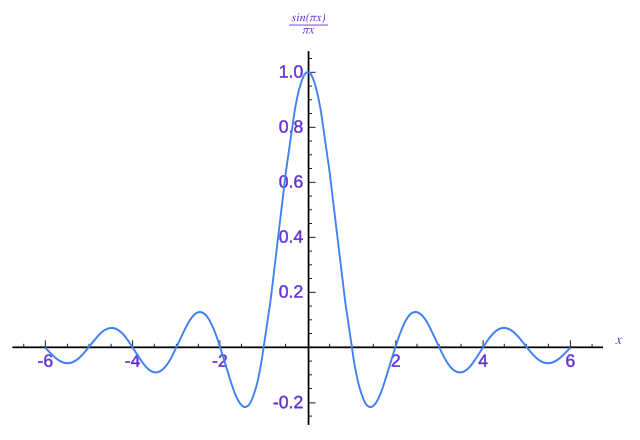
English: Graph of the normalized sinc function sin(πx)/(πx).
The original was generated by gnuplot, while the more recent one was generated with matplotlib. File size was reduced by efficient coding of the axis drawing and labeling and by a reworking of the graph's path. The resulting path is smoother even though fewer points are used in its determination.الشيفرة المصدرية لهذا الرسم المتجه صالحة. This 10.81 was created with a text editor.  Please do not replace the simplified code of this file with a version created with Inkscape or any other vector graphics editor Omegatron's instructions: الشيفرة المصدرية لهذا الرسم المتجه صالحة. .هذا الرسم المتجهي أُنشئ بواسطة أنشأه v Gnuplot |
| التاريخ | ٢٢ مايو ٢٠٠٦ (تاريخ الرفع) |
| المصدر | عمل شخصي |
| المؤلف | Omegatron |
| إصدارات أخرى |
|
| gnuplot source | click to expand
# Set 1300×975 SVG output and filename
# The font size (fsize) sets the size for the circles, too.
set samples 400
set terminal svg enhanced size 1300 975 fname "Times" fsize 36
set output "sinc function (normalized).svg"

# Set y axis limits so the plot doesn't go right to the edges of the graph
set yrange [-0.3:1.1]
set xrange [-6:6]

set lmargin 5
set bmargin -5

# No legend needed
set nokey

# Add lightly-colored axis lines
set yzeroaxis
set xzeroaxis

# Put a y-axis tic at every 0.2
set ytics 0.2
set mytics 4

# Format tics as digit with one decimal place
set format y "%2.1f"

# Put an x-axis tic at every integer
set xtics 1
set format x "%2.0f"
set mxtics 5

# Plot as lines
plot sin(pi*x)/(pi*x) with lines

# Close the file (so I don't have to close gnuplot to view it)
set output
|
.svg)
.svg)
.svg)
.svg)
ترخيص
أنا، صاحب حقوق التأليف والنشر لهذا العمل، أنشر هذا العمل تحت الرخص التالية:
- يحقُّ لك:
- مشاركة العمل – نسخ العمل وتوزيعه وبثُّه
- إعادة إنتاج العمل – تعديل العمل
- حسب الشروط التالية:
- نسب العمل إلى مُؤَلِّفه – يلزم نسب العمل إلى مُؤَلِّفه بشكل مناسب وتوفير رابط للرخصة وتحديد ما إذا أجريت تغييرات. بالإمكان القيام بذلك بأية طريقة معقولة، ولكن ليس بأية طريقة تشير إلى أن المرخِّص يوافقك على الاستعمال.
- الإلزام بترخيص المُشتقات بالمثل – إذا أعدت إنتاج المواد أو غيرت فيها، فيلزم أن تنشر مساهماتك المُشتقَّة عن الأصل تحت ترخيص الأصل نفسه أو تحت ترخيص مُتوافِقٍ معه.

|
يسمح نسخ وتوزيع و/أو تعديل هذه الوثيقة تحت شروط رخصة جنو للوثائق الحرة، الإصدار 1.2 أو أي إصدار لاحق تنشره مؤسسة البرمجيات الحرة؛ دون أقسام ثابتة ودون نصوص أغلفة أمامية ودون نصوص أغلفة خلفية. نسخة من الرخصة تم تضمينها في القسم المسمى GNU Free Documentation License. |
لك أن تختار الرخصة التي تناسبك.
تاريخ الملف
اضغط على زمن/تاريخ لرؤية الملف كما بدا في هذا الزمن.
| زمن/تاريخ | صورة مصغرة | الأبعاد | مستخدم | تعليق | |
|---|---|---|---|---|---|
| حالي | 13:42، 6 أبريل 2012 | | 908 × 623 (4 كيلوبايت) | commonswiki>Aflafla1 | Compressed Version - Sinc path computed, rest hand coded |
استخدام الملف
ال1 ملف التالي مكررات لهذا الملف (المزيد من التفاصيل):
.svg)
- ملف:Sinc function (normalized).svg من ويكيميديا كومنز
الصفحة التالية تستخدم هذا الملف:
.svg)