|
تضامنًا مع حق الشعب الفلسطيني |
ملف:Poincare-sphere arrows.svg
اذهب إلى التنقل
اذهب إلى البحث

حجم معاينة PNG لذلك الملف ذي الامتداد SVG: 600 × 600 بكسل. الأبعاد الأخرى: 240 × 240 بكسل | 480 × 480 بكسل | 768 × 768 بكسل | 1٬024 × 1٬024 بكسل | 2٬048 × 2٬048 بكسل.
الملف الأصلي (ملف SVG، أبعاده 600 × 600 بكسل، حجم الملف: 6 كيلوبايت)
| هذا ملف من ويكيميديا كومنز. معلومات من صفحة وصفه مبينة في الأسفل. كومنز مستودع ملفات ميديا ذو رخصة حرة. |
ملخص
| الوصف |
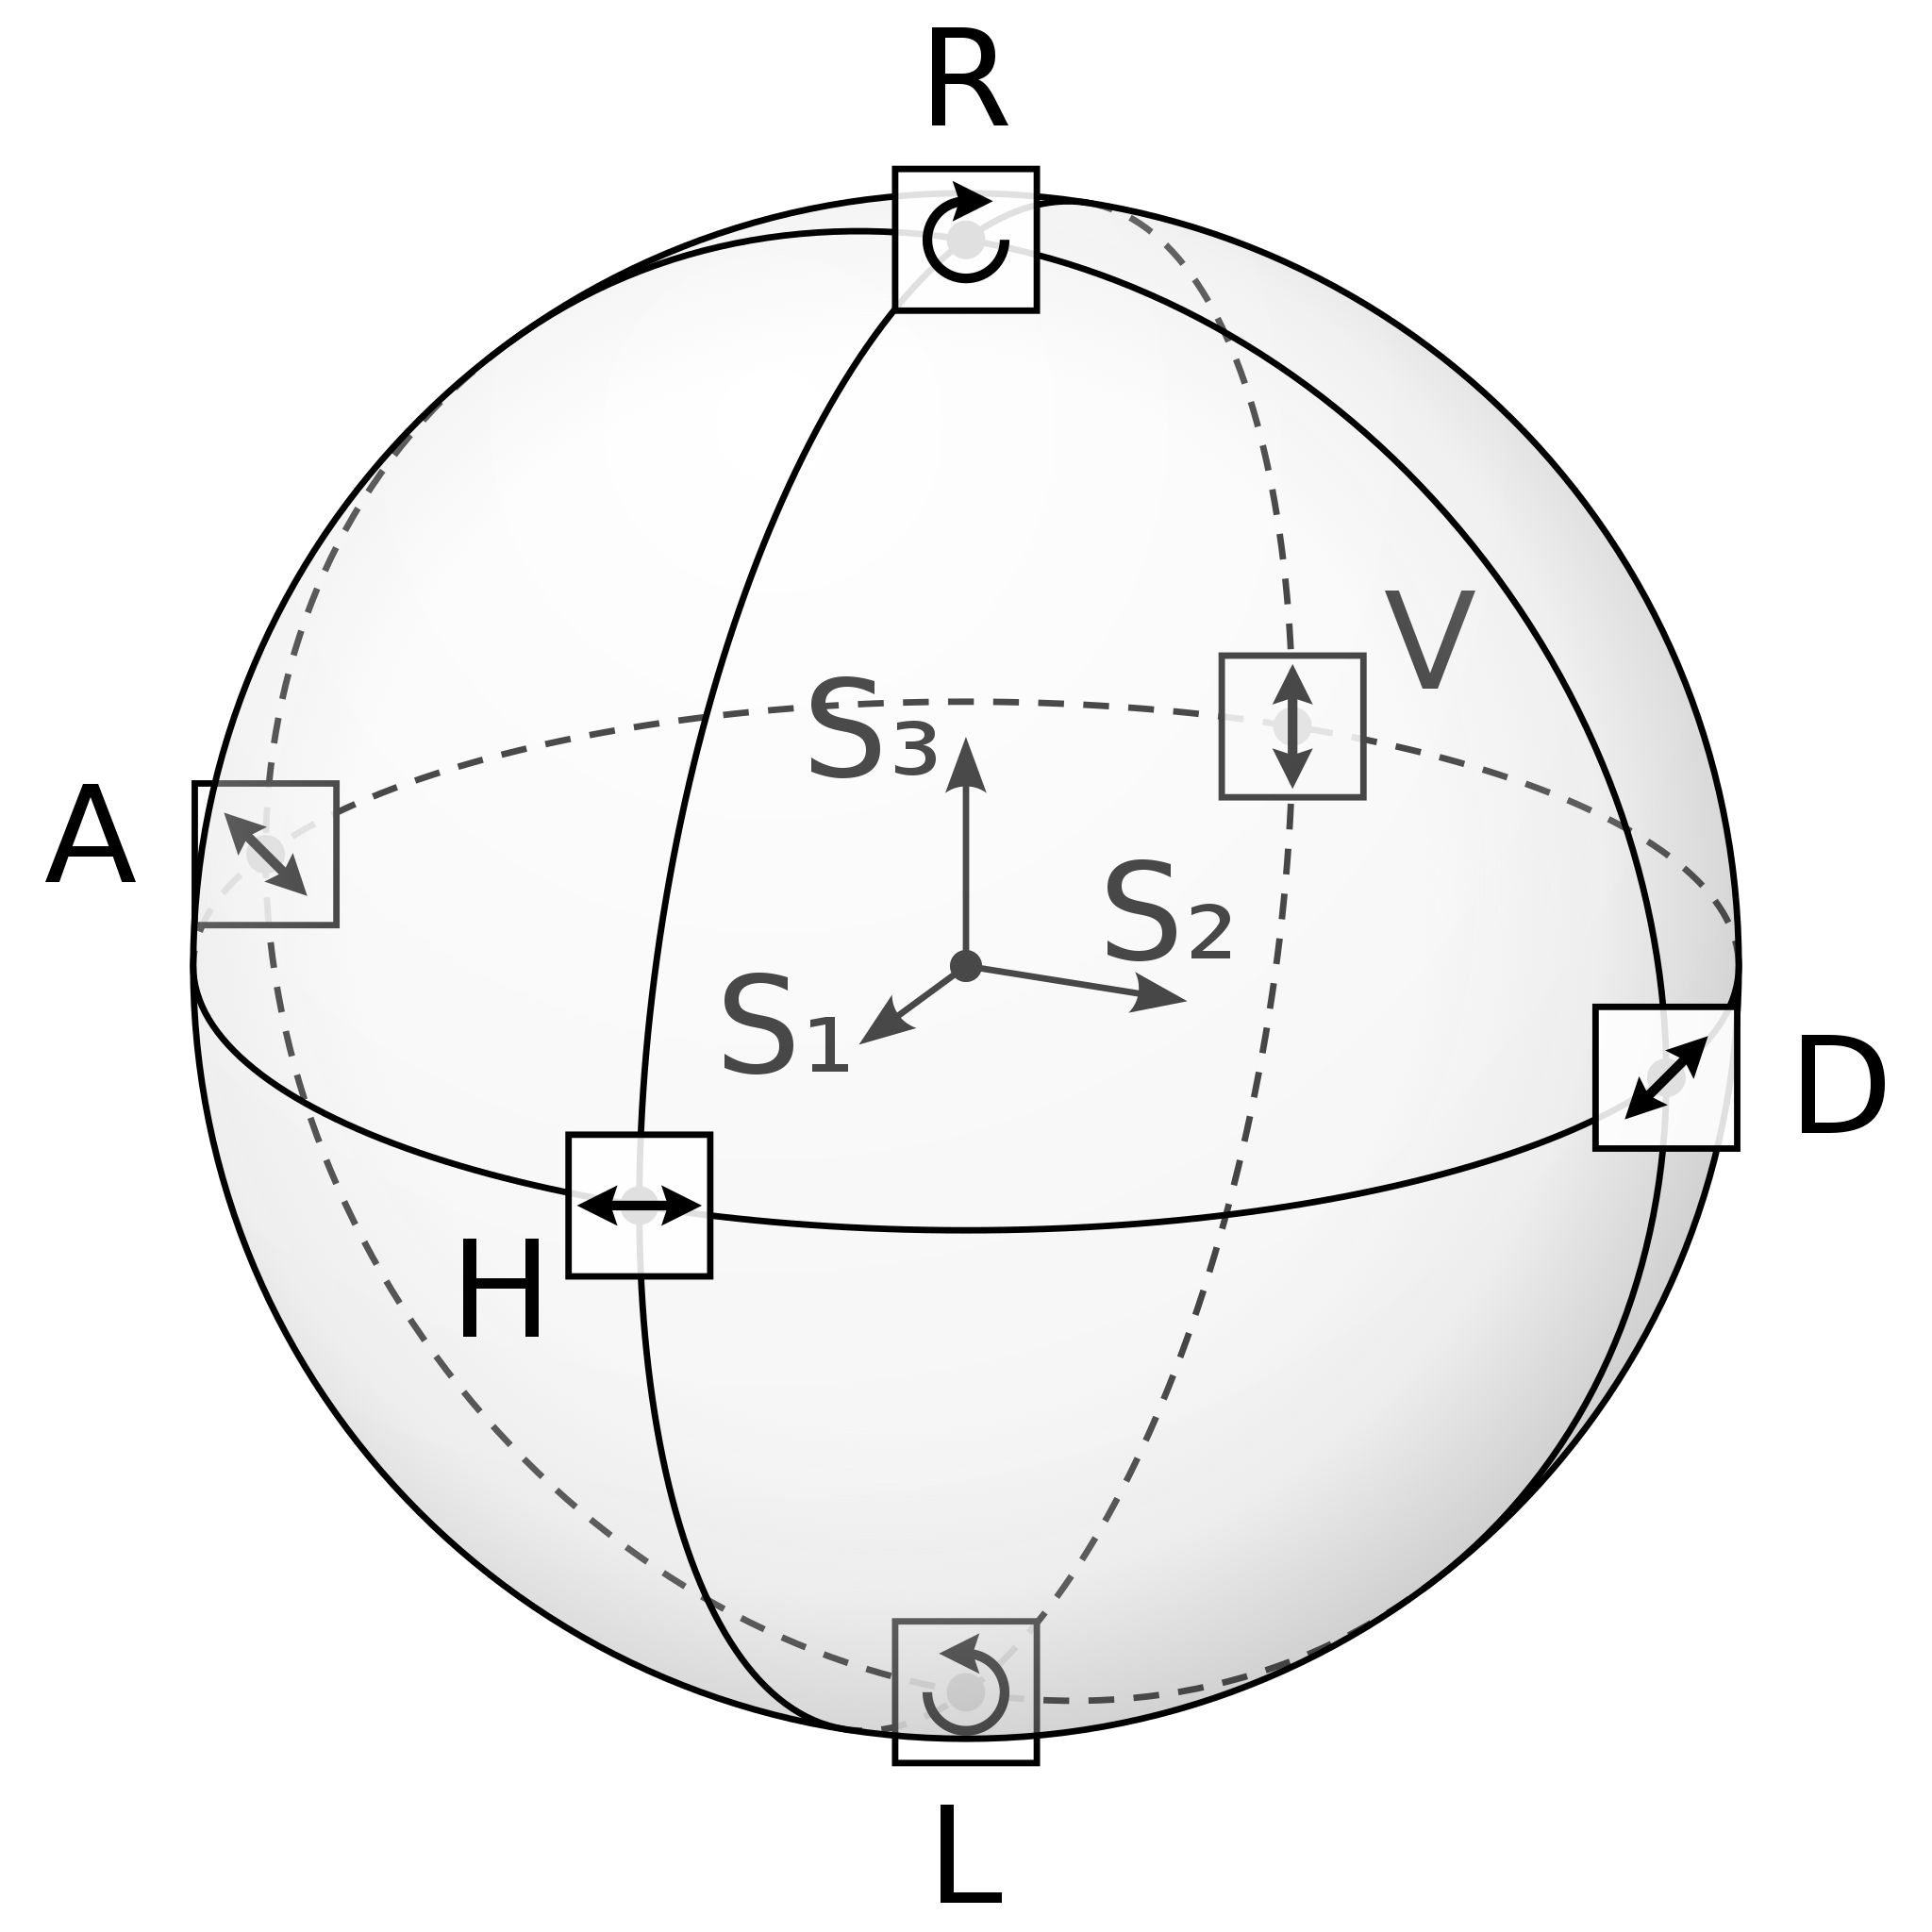
English: Drawing of a Poincaré sphere, which illustrates the space of possible polarisations of electromagnetic waves. The sphere is drawn with three great circles, labels for six basic polarisations H (linear horizontal), V (linear vertical), D (linear diagonal), A (linear antidiagonal), R (right-hand circular) and L (left-hand circular) and images of the polarisation vectors for each. Additionally the coordinate system of Stokes vectors with components S₁, S₂ and S₃ is drawn in the center of the sphere.
Deutsch: Zeichnung einer Poincaré-Kugel, die den Raum der möglichen Polarisationen elektromagnetischer Wellen darstellt. Die Kugel ist mit drei Großkreisen gezeichnet, Zeichen für die sechs Basispolarisationen H (linear horizontal), V (linear vertikal), D (linear diagonal), A (linear antidiagonal), R (rechtshändig zirkular) and L (linkshändig zirkular) und mit Bildern der Polarisationsvektoren für jede davon. Zusätzlich befindet sich im Zentrum der Kugel das Koordinatensystem aus Stokesvektorkomponenten S₁, S₂ and S₃. |
| التاريخ | |
| المصدر | عمل شخصي |
| المؤلف | Geek3 |
| إصدارات أخرى | Poincare-sphere_stokes.svg (without the small images of the polarisation vectors) |
Source Code
The image is created by the following source-code. Requirements:
python source code:
try:
    import svgwrite as svg
except ImportError:
    print 'You need to install svgwrite: http://pypi.python.org/pypi/svgwrite/'
    # documentation at http://pythonhosted.org/svgwrite/
    exit(1)

from math import *

def to_xyz(theta, phi, r=1):
    return r * sin(theta) * cos(phi), r * sin(theta) * sin(phi), r * cos(theta)

def to_theta_phi_r(x, y, z):
    return atan2(z, sqrt(x**2 + y**2)), atan2(x, y), sqrt(x**2+y**2+z**2)

def rotx(x, y, z, a):
    y, z = cos(a) * y + sin(a) * z, cos(a) * z - sin(a) * y
    return x, y, z

def ellipse_path(theta, phi, tilt, flip=False):
    t, p, r2 = to_theta_phi_r(*rotx(*(to_xyz(theta, phi, 1) + (tilt,))))
    a = abs(r)
    b = abs(r * sin(t))
    return 'M %f,%f A %f,%f %f %i,%i %f,%f' % (-r*cos(p), -r*sin(p),
        a, b, p*180/pi, 0, {True:1, False:0}[flip], r*cos(p), r*sin(p))

# document
size = 600, 600
doc = svg.Drawing('poincare-sphere_arrows.svg', profile='full', size=size)
doc.set_desc('poincare-sphere_arrows.svg', '''Drawing of a poincare-sphere with polarisations H, V, D, A, R and L, a coordinate system of Stokes-Vectors P1, P2 and P3 and six little images that illustrate the polarisations
rights: GNU Free Documentation license,
        Creative Commons Attribution ShareAlike license''')

# settings
dash = '8,6'
col = 'black'
r = 240
tilt = radians(-70)
phi = radians(-25)
cp, sp = cos(phi), sin(phi)

# background
doc.add(doc.rect(id='background', profile='full', insert=(0, 0), size=size, fill='white', stroke='none'))

# arrow markers
arrow_d = 'M -4,0 L 2,-3 L 1,0 L 2,3 L -4,0 z'
arrow1 = doc.marker(id='arrow1', orient='auto', overflow='visible')
arrow1.add(doc.path(d=arrow_d, fill=col, stroke='none',
    transform='rotate(180) scale(0.7)'))
doc.defs.add(arrow1)
arrow2 = doc.marker(id='arrow2', orient='auto', overflow='visible')
arrow2.add(doc.path(d=arrow_d, fill=col, stroke='none',
    transform='scale(0.7)'))
doc.defs.add(arrow2)
arrow3 = doc.marker(id='arrow3', orient='auto', overflow='visible')
arrow3.add(doc.path(d='M 8.7185878,4.0337352 L -2.2072895,0.016013256 L 8.7185884,-4.0017078 C 6.9730900,-1.6296469 6.9831476,1.6157441 8.7185878,4.0337352 z', fill=col, stroke='none',
    transform='scale(0.8) rotate(180)'))
doc.defs.add(arrow3)

# make a group for the sphere
sphere = doc.g(transform='translate(300, 300)', fill='none', stroke=col, stroke_width='2')
sphere['font-family'] = 'DejaVu Sans'
sphere['font-size'] = '42px'
doc.add(sphere)

# back ellipses
sphere.add(doc.path(d=ellipse_path(0, 0, tilt),
    stroke_dasharray=dash, stroke=col))
sphere.add(doc.path(d=ellipse_path(pi/2, phi, tilt, True),
    stroke_dasharray=dash, stroke=col))
sphere.add(doc.path(d=ellipse_path(pi/2, phi+pi/2, tilt),
    stroke_dasharray=dash, stroke=col))

# draw coordinate axes
sphere.add(doc.circle(center=(0, 0), r=5, fill=col, stroke='none'))
for i in range(3):
    xyz = [0, 0, 0]
    xyz[i] = 0.3 * r
    x, y, z = xyz
    x, y, z = rotx(x*cp + y*sp, y*cp - x*sp, z, tilt)
    line = doc.line(start=(0, 0), end=('%f' % x, '%f' % y), stroke=col)
    line['marker-end'] = arrow3.get_funciri()
    sphere.add(line)

# the six defined points
pts = []
for x,y,z in [[0,0,-1], [0,0,1], [0,-1,0], [0,1,0], [-1,0,0], [1,0,0]]:
    x, y, z = rotx(r * (x*cp + y*sp), r * (y*cp - x*sp), r * z, tilt)
    if z >= 0:
        continue
    pts.append((x, y))
    sphere.add(doc.circle(center=('%f' % x, '%f' % y), r=6,
        fill=col, stroke='none'))

# inset images
rect = doc.rect((-22, -22), (44, 44), fill='white', stroke=col, fill_opacity=0.88)

gV = doc.g(transform='translate(%f, %f)' % pts[1])
gV.add(rect)
gV.add(doc.line(start=(0,-11), end=(0,11), stroke_width=3,
    marker_end=arrow1.get_funciri(), marker_start=arrow2.get_funciri()))
sphere.add(gV)

gA = doc.g(transform='translate(%f, %f)' % pts[2])
gA.add(rect)
gA.add(doc.line(start=(-7,-7), end=(7,7), stroke_width=3,
    marker_end=arrow1.get_funciri(), marker_start=arrow2.get_funciri()))
sphere.add(gA)

gL = doc.g(transform='translate(%f, %f)' % pts[0])
gL.add(rect)
gL.add(doc.path(d='M -12,0 A 12,12 0 1,0 0,-12', stroke_width=3,
    marker_end=arrow1.get_funciri()))
sphere.add(gL)

# V label
sphere.add(doc.text('V', text_anchor='middle',
    transform='translate(144, -86)', stroke='none', fill=col))

# Stokes-Vector labels
sphere.add(doc.text('S₁', text_anchor='middle',
    transform='translate(-56, 33)', stroke='none', fill=col))
sphere.add(doc.text('S₂', text_anchor='middle',
    transform='translate(63, -2)', stroke='none', fill=col))
sphere.add(doc.text('S₃', text_anchor='middle',
    transform='translate(-29, -59)', stroke='none', fill=col))

# sphere surface
grad1 = doc.defs.add(doc.radialGradient(id='grad1',
    center=(0.375, 0.15), r=0.75, gradientUnits='objectBoundingBox'))
grad1.add_stop_color(offset=0, color='#ffffff', opacity=0.3)
grad1.add_stop_color(offset=1, color='#dddddd', opacity=0.3)
sphere.add(doc.circle(center=(0, 0), r=str(r),
    fill='url(#grad1)', stroke='none'))
grad2 = doc.defs.add(doc.radialGradient(id='grad2',
    center=(0.45, 0.45), r=0.575, gradientUnits='objectBoundingBox'))
grad2.add_stop_color(offset=0.6, color='#cccccc', opacity=0)
grad2.add_stop_color(offset=0.8, color='#cccccc', opacity=0.2)
grad2.add_stop_color(offset=1, color='#333333', opacity=0.2)
sphere.add(doc.circle(center=(0, 0), r=str(r),
    fill='url(#grad2)', stroke='none'))

# the six defined points
for x,y,z in [[0,0,-1], [0,0,1], [0,-1,0], [0,1,0], [-1,0,0], [1,0,0]]:
    x, y, z = rotx(r * (x*cp + y*sp), r * (y*cp - x*sp), r * z, tilt)
    if z < 0:
        continue
    pts.append((x, y))
    sphere.add(doc.circle(center=('%f' % x, '%f' % y), r=6,
        fill=col, stroke='none'))

# H, D, A, R, L labels
sphere.add(doc.text('H', text_anchor='middle',
    transform='translate(-144, 115)', stroke='none', fill=col))
sphere.add(doc.text('D', text_anchor='middle',
    transform='translate(272, 52)', stroke='none', fill=col))
sphere.add(doc.text('A', text_anchor='middle',
    transform='translate(-272, -26)', stroke='none', fill=col))
sphere.add(doc.text('R', text_anchor='middle',
    transform='translate(0, -261)', stroke='none', fill=col))
sphere.add(doc.text('L', text_anchor='middle',
    transform='translate(0, 291)', stroke='none', fill=col))

# front ellipses
sphere.add(doc.path(d=ellipse_path(0, 0, tilt, True)))
sphere.add(doc.path(d=ellipse_path(pi/2, phi, tilt)))
sphere.add(doc.path(d=ellipse_path(pi/2, phi+pi/2, tilt, True)))

# circle edge
sphere.add(doc.circle(center=(0, 0), r=str(r)))

# inset images
gH = doc.g(transform='translate(%f, %f)' % pts[4])
gH.add(rect)
gH.add(doc.line(start=(-11,0), end=(11,0), stroke_width=3,
    marker_end=arrow1.get_funciri(), marker_start=arrow2.get_funciri()))
sphere.add(gH)

gD = doc.g(transform='translate(%f, %f)' % pts[5])
gD.add(rect)
gD.add(doc.line(start=(-7,7), end=(7,-7), stroke_width=3,
    marker_end=arrow1.get_funciri(), marker_start=arrow2.get_funciri()))
sphere.add(gD)

gR = doc.g(transform='translate(%f, %f)' % pts[3])
gR.add(rect)
gR.add(doc.path(d='M 12,0 A 12,12 0 1,1 0,-12', stroke_width=3,
    marker_end=arrow1.get_funciri()))
sphere.add(gR)

doc.save()
ترخيص
أنا، صاحب حقوق التأليف والنشر لهذا العمل، أنشر هذا العمل تحت الرخص التالية:

|
يسمح نسخ وتوزيع و/أو تعديل هذه الوثيقة تحت شروط رخصة جنو للوثائق الحرة، الإصدار 1.2 أو أي إصدار لاحق تنشره مؤسسة البرمجيات الحرة؛ دون أقسام ثابتة ودون نصوص أغلفة أمامية ودون نصوص أغلفة خلفية. نسخة من الرخصة تم تضمينها في القسم المسمى GNU Free Documentation License. |
هذا الملف مُرخص تحت رخصة المشاع المبدع نسبة المصنف إلى مؤلفه 3.0 العامة
- يحقُّ لك:
- مشاركة العمل – نسخ العمل وتوزيعه وبثُّه
- إعادة إنتاج العمل – تعديل العمل
- حسب الشروط التالية:
- نسب العمل إلى مُؤَلِّفه – يلزم نسب العمل إلى مُؤَلِّفه بشكل مناسب وتوفير رابط للرخصة وتحديد ما إذا أجريت تغييرات. بالإمكان القيام بذلك بأية طريقة معقولة، ولكن ليس بأية طريقة تشير إلى أن المرخِّص يوافقك على الاستعمال.
لك أن تختار الرخصة التي تناسبك.
تاريخ الملف
اضغط على زمن/تاريخ لرؤية الملف كما بدا في هذا الزمن.
| زمن/تاريخ | صورة مصغرة | الأبعاد | مستخدم | تعليق | |
|---|---|---|---|---|---|
| حالي | 21:44، 31 أغسطس 2014 | | 600 × 600 (6 كيلوبايت) | commonswiki>Geek3 | Poincare Sphere with Stokes vectors and polarisation arrows |
استخدام الملف
ال1 ملف التالي مكررات لهذا الملف (المزيد من التفاصيل):
- ملف:Poincare-sphere arrows.svg من ويكيميديا كومنز
الصفحة التالية تستخدم هذا الملف: