|
تضامنًا مع حق الشعب الفلسطيني |
ملف:COVID-19 Prevalence in Montana by county.svg

الملف الأصلي (ملف SVG، أبعاده 400 × 230 بكسل، حجم الملف: 67 كيلوبايت)
| هذا ملف من ويكيميديا كومنز. معلومات من صفحة وصفه مبينة في الأسفل. كومنز مستودع ملفات ميديا ذو رخصة حرة. |
ملخص
| الوصف |
English: {| cellspacing="8" cellpadding="0" style="width:100%; clear:both; margin:0.5em auto; background-color:var(--background-color-neutral-subtle, #f8f9fa); color:var(--color-base, #202122); border:2px solid #4488dd; " lang="ar" dir="rtl"
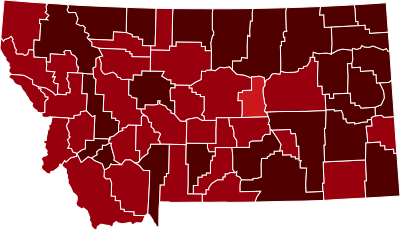
| style="width:50px" | This map shows confirmed cases of w:en:COVID-19, coded by percentage of population confirmed to be infected as of 29 March 2021. The data is used from the data as aggregated and released by Johns Hopkins University and US census (2019 population estimate). As this is a current outbreak, the map might not be up to date. 10.00%+ Confirmed infected
3.00%-10.00% Confirmed infected
1.00%-3.00% Confirmed infected
0.30%-1.00% Confirmed infected
0.10%-0.30% Confirmed infected
0.03%-0.10% Confirmed infected
0.00%-0.03% Confirmed infected
no confirmed cases or no data
The design is based on blank maps available in Public Domain (created by Yiling Chen from TIGER shapefiles), the color scheme is based on color brewer. The script for creating the maps was written by Sukolsak Sakshuwong and Lodewijk Gelauff.
|
||
| التاريخ | |||
| المصدر | عمل شخصي | ||
| المؤلف | Effeietsanders |

ترخيص
| هذا الملف متوفر تحت ترخيص المشاع الإبداعي CC0 1.0 الحقوق العامة. | |
| لقد وَضَعَ صاحب حقوق التَّأليف والنَّشر هذا العملَ في النَّطاق العامّ من خلال تنازُلِه عن حقوق العمل كُلِّها في أنحاء العالم جميعها تحت قانون حقوق التَّأليف والنَّشر، ويشمل ذلك الحقوق المُتَّصِلة بها والمُجاورة لها برمتها بما يتوافق مع ما يُحدده القانون. يمكنك نسخ وتعديل وتوزيع وإعادة إِنتاج العمل، بما في ذلك لأغراضٍ تجاريَّةٍ، دون حاجةٍ لطلب مُوافَقة صاحب حقوق العمل.
|
تاريخ الملف
اضغط على زمن/تاريخ لرؤية الملف كما بدا في هذا الزمن.
| زمن/تاريخ | صورة مصغرة | الأبعاد | مستخدم | تعليق | |
|---|---|---|---|---|---|
| حالي | 00:39، 18 مارس 2021 | | 400 × 230 (67 كيلوبايت) | commonswiki>Eiabot | new data: 16 March 2021 |
استخدام الملف
ال1 ملف التالي مكررات لهذا الملف (المزيد من التفاصيل):
- ملف:COVID-19 Prevalence in Montana by county.svg من ويكيميديا كومنز
الصفحة التالية تستخدم هذا الملف: