|
تضامنًا مع حق الشعب الفلسطيني |
ملف:Binding energy curve - common isotopes.svg

الملف الأصلي (ملف SVG، أبعاده 671 × 441 بكسل، حجم الملف: 22 كيلوبايت)
| هذا ملف من ويكيميديا كومنز. معلومات من صفحة وصفه مبينة في الأسفل. كومنز مستودع ملفات ميديا ذو رخصة حرة. |
ملخص
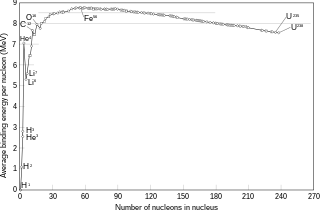
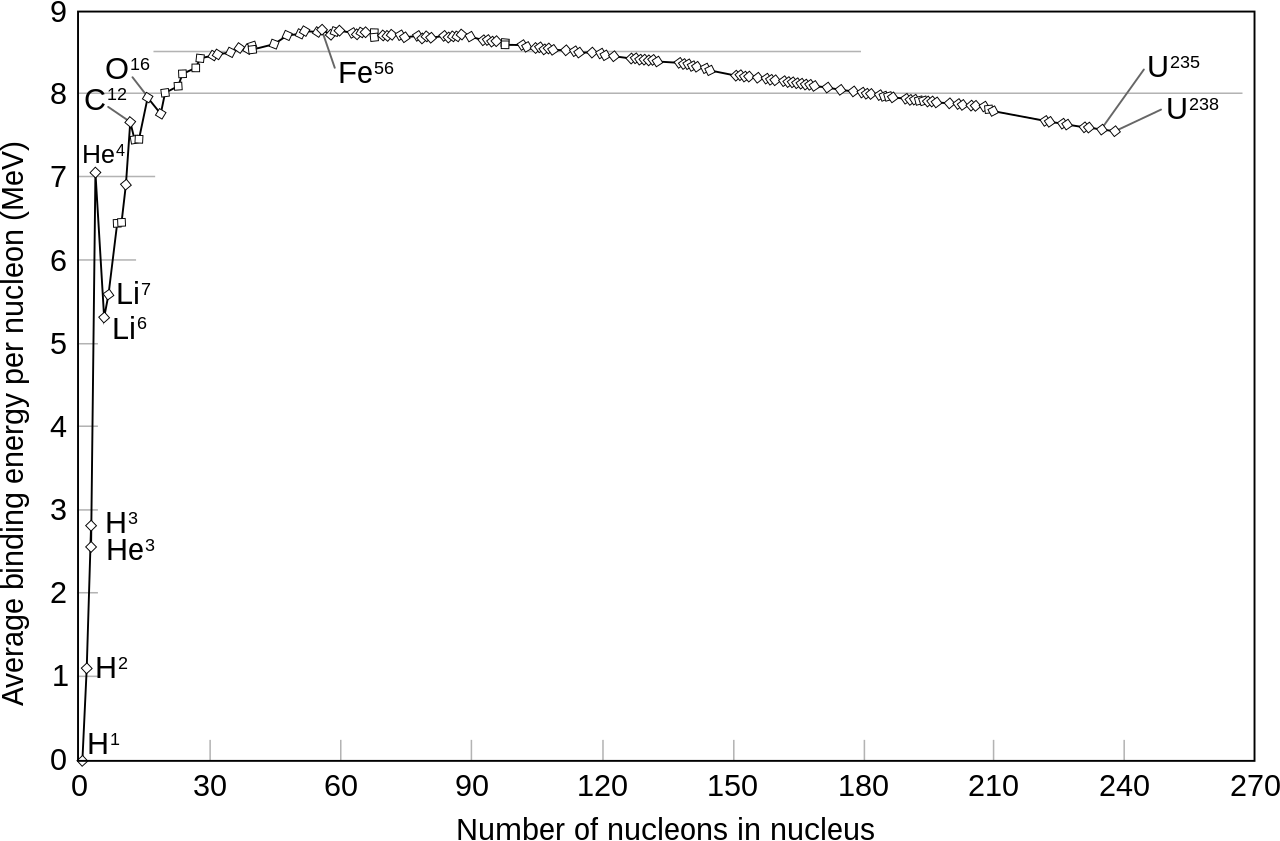
Binding energy curve (average binding energy per nucleon in MeV against number of nucleons in nucleus) for a number of relatively common (abundant) isotopes (not chosen systematically; almost anything with an occurence of over .2 was chosen though a few exceptions are in there, such as U235). A few important ones for the purposes of nuclear fusion and nuclear fission are marked, as well as iron-56, which sits at the highest point on this graph and cannot yield energy from fission (though it can theoretically fuse with hydrogen, deuterium, helium or carbon). (The graph does not have nickel-62, which actually has a higher binding energy than iron-56.)
Data set was taken from here (archived from the original) and the exact set used to generate this graph has been posted to this talk page.
Created in Excel, exported to Adobe Illustrator, exported to Inkscape, and rendered into this graph, by User:Fastfission.
ترخيص
| وضع -Fastfission-، وهو المؤلف، هذا العمل في النِّطاق العامِّ. يسري ذلك في كل أرجاء العالم. في بعض البلدان، قد يكون هذا التَّرخيص غيرَ مُمكنٍ قانونيَّاً، في هذه الحالة: |
If you want to credit someone, credit "Wikimedia Commons." Otherwise don't credit anyone, that's fine by me. --Fastfission 15:01, 14 April 2008 (UTC)

|
يحتوي الملفُّ الشُّعاعي هذا على نصٍّ مُضمَّن يُمكِن ترجمته إِلى العربيَّة باستخدام مُحرر صور شعاعيَّةٍ أو مُحررٍ نصِّيٍّ، لمزيدٍ من المعلومات، راجع: هذه الصَّفحة. |
derivative works
[]
SVG:
-
 الألمانية
 -
 الإنجليزية
 -
 الإسبانية
 -
 الفنلندية
 -
 الفرنسية
 -
 الإندونيسية
 -
 الروسية
 -
 التركية
 -
 الأوكرانية
 -
 العربية


JPG:
-
 الإنجليزية

تاريخ الملف
اضغط على زمن/تاريخ لرؤية الملف كما بدا في هذا الزمن.
| زمن/تاريخ | صورة مصغرة | الأبعاد | مستخدم | تعليق | |
|---|---|---|---|---|---|
| حالي | 15:30، 15 مارس 2022 | | 671 × 441 (22 كيلوبايت) | commonswiki>Jlabwiki | File uploaded using svgtranslate tool (https://svgtranslate.toolforge.org/). Added translation for fr. |
استخدام الملف
ال1 ملف التالي مكررات لهذا الملف (المزيد من التفاصيل):
- ملف:Binding energy curve - common isotopes.svg من ويكيميديا كومنز
ال4 صفحات التالية تستخدم هذا الملف: