|
تضامنًا مع حق الشعب الفلسطيني |
ملف:2006Tanzanian exports.PNG
اذهب إلى التنقل
اذهب إلى البحث

حجم هذه المعاينة: 800 × 351 بكسل. الأبعاد الأخرى: 320 × 140 بكسل | 640 × 281 بكسل | 1٬425 × 625 بكسل.
الملف الأصلي (1٬425 × 625 بكسل حجم الملف: 62 كيلوبايت، نوع MIME: image/png)
| هذا ملف من ويكيميديا كومنز. معلومات من صفحة وصفه مبينة في الأسفل. كومنز مستودع ملفات ميديا ذو رخصة حرة. |
| الوصف |
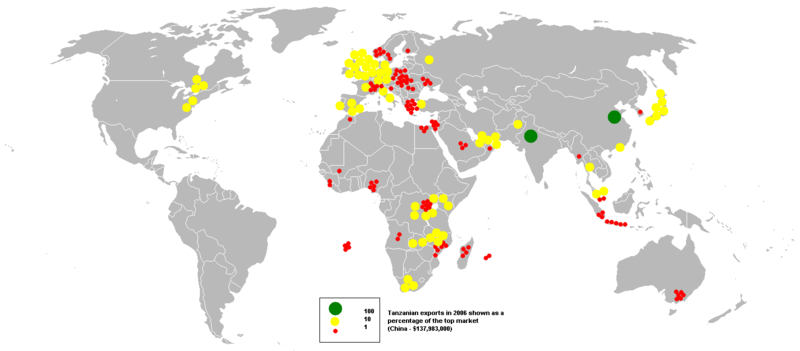
English: This bubble map shows the global distribution of Tanzanian exports in 2006 as a percentage of the top market (China - $137,983,000).
This map is consistent with incomplete set of data too as long as the top producer is known. It resolves the accessibility issues faced by colour-coded maps that may not be properly rendered in old computer screens. Data was extracted on 23rd September 2007 from http://www.imfstatistics.org/DOT Based on en:Image:BlankMap-World.png |
| التاريخ | ٢٣ سبتمبر ٢٠٠٧ (تاريخ الرفع الأصيل) |
| المصدر | نُقِلت من en.wikipedia إلى كُومُنز . |
| المؤلف | Anwar saadat في ويكيبيديا الإنجليزية |
ترخيص
| وضع -Anwar saadat في ويكيبيديا الإنجليزية-، وهو المؤلف، هذا العمل في النِّطاق العامِّ. يسري ذلك في كل أرجاء العالم. في بعض البلدان، قد يكون هذا التَّرخيص غيرَ مُمكنٍ قانونيَّاً، في هذه الحالة: يمنح Anwar saadat الجميع حق استخدام هذا العمل لأي غرض دون أي شرط ما لم يفرض القانون شروطًا إضافية. |
سجلُّ الرَّفع الأصيل
صفحة الوصف الأصلية كانت هنا، تشير جميع أسماء المستخدمين التالية إلى en.wikipedia.
- 2007-09-23 11:58 Anwar saadat 1425×625×??? (63145 bytes) This bubble map shows the global distribution of Tanzanian exports in 2006 as a percentage of the top market (China - $137,983,000). This map is consistent with incomplete set of data too as long as the top producer is known. It resolves the accessibilit
تاريخ الملف
اضغط على زمن/تاريخ لرؤية الملف كما بدا في هذا الزمن.
| زمن/تاريخ | صورة مصغرة | الأبعاد | مستخدم | تعليق | |
|---|---|---|---|---|---|
| حالي | 11:03، 18 أغسطس 2008 | | 1٬425 × 625 (62 كيلوبايت) | commonswiki>Lunofabo | {{Information |Description={{en|This bubble map shows the global distribution of Tanzanian exports in 2006 as a percentage of the top market (China - $137,983,000). This map is consistent with incomplete set of |
استخدام الملف
ال1 ملف التالي مكررات لهذا الملف (المزيد من التفاصيل):
- ملف:2006Tanzanian exports.PNG من ويكيميديا كومنز
الصفحة التالية تستخدم هذا الملف: