|
تضامنًا مع حق الشعب الفلسطيني |
ملف:Navier Stokes Laminar.svg

الملف الأصلي (ملف SVG، أبعاده 900 × 720 بكسل، حجم الملف: 9٫37 ميجابايت)
| هذا ملف من ويكيميديا كومنز. معلومات من صفحة وصفه مبينة في الأسفل. كومنز مستودع ملفات ميديا ذو رخصة حرة. |
ملخص
| الوصفNavier Stokes Laminar.svg |
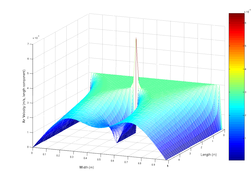
English: SVG illustration of the classic Navier-Stokes obstructed duct problem, which is stated as follows. There is air flowing in the 2-dimensional rectangular duct. In the middle of the duct, there is a point obstructing the flow. We may leverage Navier-Stokes equation to simulate the air velocity at each point within the duct. This plot gives the air velocity component of the direction along the duct. One may refer to [1], in which Eq. (3) is a little simplified version compared with ours. |
| التاريخ | |
| المصدر |
عمل شخصي
The following code leverages some numerical methods to simulate the solution of the 2-dimensional Navier-Stokes equation. We choose the simplified incompressible flow Navier-Stokes Equation as follows: The iterations here are based on the velocity change rate, which is given by Or in X coordinates: |
| المؤلف | IkamusumeFan |
| إصدارات أخرى |
  |
| SVG منشأ الملف InfoField | الشيفرة المصدرية لهذا الرسم المتجه صالحة. هذا الرسم المتجهي أُنشئ بواسطة Matplotlib |
| نص برمجي مصدري InfoField | Python codefrom __future__ import division
from numpy import arange, meshgrid, sqrt, zeros, sum
import matplotlib.pyplot as plt
from mpl_toolkits.mplot3d import Axes3D
from matplotlib.ticker import ScalarFormatter
from matplotlib import rcParams
rcParams['font.family'] = 'serif'
rcParams['font.size'] = 16
# the layout of the duct laminar
x_max = 5 # duct length
y_max = 1 # duct width
# draw the frames, including the angles and labels
ax = Axes3D(plt.figure(figsize=(10, 8)), azim=20, elev=20)
ax.set_xlabel(r"$x$", fontsize=20)
ax.set_ylabel(r"$y$", fontsize=20)
ax.zaxis.set_rotate_label(False)
ax.set_zlabel(r"$v_x$", fontsize=20, rotation='horizontal')
formatter = ScalarFormatter(useMathText=True)
formatter = ScalarFormatter()
formatter.set_scientific(True)
formatter.set_powerlimits((-2,2))
ax.w_zaxis.set_major_formatter(formatter)
ax.set_xlim([0, x_max])
ax.set_ylim([0, y_max])
# initial speed of the air
ini_v = 3e-3
mu = 1e-5
rho = 1.3
# the acceptable difference when termination
accept_diff = 1e-5
# time interval
time_delta = 1.0
# coordinate interval
delta = 1e-2;
X = arange(0, x_max + delta, delta)
Y = arange(0, y_max + delta, delta)
# number of coordinate points
x_size = len(X) - 1
y_size = len(Y) - 1
Vx = zeros((len(X), len(Y)))
Vy = zeros((len(X), len(Y)))
new_Vx = zeros((len(X), len(Y)))
new_Vy = zeros((len(X), len(Y)))
# initial conditions
Vx[1: x_size - 1, 2:y_size - 1] = ini_v
# start evolution and computation
res = 1 + accept_diff
rounds = 0
alpha = mu/(rho * delta**2)
while (res>accept_diff and rounds<100):
"""
The iterations here are based on the velocity change rate, which
is given by
\frac{\partial v}{\partial t} = \alpha\nabla^2 v - v \cdot \nabla v
with \alpha = \mu/\rho.
"""
new_Vx[2:-2, 2:-2] = Vx[2:-2, 2:-2] + time_delta*(alpha*(Vx[3:-1, 2:-2] +
Vx[2:-2, 3:-1] - 4*Vx[2:-2, 2:-2] + Vx[2:-2, 1:-3] + Vx[1:-3, 2:-2]) -
0.5/delta * (Vx[2:-2, 2:-2] * (Vx[3:-1, 2:-2] - Vx[1:-3, 2:-2]) +
Vy[2:-2, 2:-2]*(Vx[2:-2, 3:-1] - Vx[2:-2, 1:-3])))
new_Vy[2:-2, 2:-2] = Vy[2:-2, 2:-2] + time_delta*(alpha*(Vy[3:-1, 2:-2] +
Vy[2:-2, 3:-1] - 4*Vy[2:-2, 2:-2] + Vy[2:-2, 1:-3] + Vy[1:-3, 2:-2]) -
0.5/delta * (Vy[2:-2, 2:-2] * (Vy[2:-2, 3:-1] - Vy[2:-2, 3:-1]) +
Vx[2:-2, 2:-2]*(Vy[3:-1, 2:-2] - Vy[1:-3, 2:-2])))
rounds = rounds + 1
# copy the new values
Vx[2:-2, 2:-2] = new_Vx[2:-2, 2:-2]
Vy[2:-2, 2:-2] = new_Vy[2:-2, 2:-2]
# set free boundary conditions: dv_x/dx = dv_y/dx = 0.
Vx[-1, 1:-1] = Vx[-3, 1:-1]
Vx[-2, 1:-1] = Vx[-3, 1:-1]
Vy[-1, 1:-1] = Vy[-3, 1:-1]
Vy[-2, 1:-1] = Vy[-3, 1:-1]
# there exists a still object in the plane
Vx[x_size//3:x_size//1.5, y_size//2.0] = 0
Vy[x_size//3:x_size//1.5, y_size//2.0] = 0
# calculate the residual of Vx
res = (Vx[3:-1, 2:-2] + Vx[2:-2, 3:-1] -
Vx[1:-3, 2:-2] - Vx[2:-2, 1:-3])**2
res = sum(res)/(4 * delta**2 * x_size * y_size)
# prepare the plot data
Z = sqrt(Vx**2)
# refine the region boundary
Z[0, 1:-2] = Z[1, 1:-2]
Z[-2, 1:-2] = Z[-3, 1:-2]
Z[-1, 1:-2] = Z[-3, 1:-2]
Y, X = meshgrid(Y, X);
ax.plot_surface(X, Y, Z, rstride=1, cstride=1, cmap="summer", lw=0.1,
edgecolors="k")
plt.savefig("Navier_Stokes_Laminar.svg")
|
ترخيص
- يحقُّ لك:
- مشاركة العمل – نسخ العمل وتوزيعه وبثُّه
- إعادة إنتاج العمل – تعديل العمل
- حسب الشروط التالية:
- نسب العمل إلى مُؤَلِّفه – يلزم نسب العمل إلى مُؤَلِّفه بشكل مناسب وتوفير رابط للرخصة وتحديد ما إذا أجريت تغييرات. بالإمكان القيام بذلك بأية طريقة معقولة، ولكن ليس بأية طريقة تشير إلى أن المرخِّص يوافقك على الاستعمال.
- الإلزام بترخيص المُشتقات بالمثل – إذا أعدت إنتاج المواد أو غيرت فيها، فيلزم أن تنشر مساهماتك المُشتقَّة عن الأصل تحت ترخيص الأصل نفسه أو تحت ترخيص مُتوافِقٍ معه.
- ↑ Fan, Chien, and Bei-Tse Chao. "Unsteady, laminar, incompressible flow through rectangular ducts." Zeitschrift für angewandte Mathematik und Physik ZAMP 16, no. 3 (1965): 351-360.
الشروحات
العناصر المصورة في هذا الملف
يُصوِّر
تاريخ الملف
اضغط على زمن/تاريخ لرؤية الملف كما بدا في هذا الزمن.
| زمن/تاريخ | صورة مصغرة | الأبعاد | مستخدم | تعليق | |
|---|---|---|---|---|---|
| حالي | 05:06، 15 مارس 2016 |  | 900 × 720 (9٫37 ميجابايت) | commonswiki>Nicoguaro | Smaller version |
استخدام الملف
ال1 ملف التالي مكررات لهذا الملف (المزيد من التفاصيل):
- ملف:Navier Stokes Laminar.svg من ويكيميديا كومنز
ال3 صفحات التالية تستخدم هذا الملف:
بيانات وصفية
هذا الملف يحتوي على معلومات إضافية، غالبا ما تكون أضيفت من قبل الكاميرا الرقمية أو الماسح الضوئي المستخدم في إنشاء الملف.
إذا كان الملف قد عدل عن حالته الأصلية، فبعض التفاصيل قد لا تعبر عن الملف المعدل.
| العرض | 720pt |
|---|---|
| الارتفاع | 576pt |


